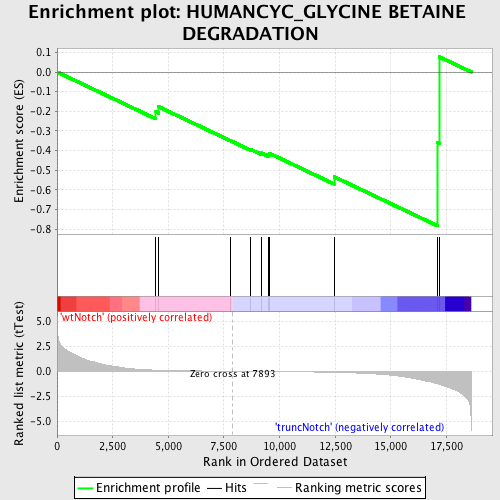
Profile of the Running ES Score & Positions of GeneSet Members on the Rank Ordered List
| Dataset | Set_03_truncNotch_versus_wtNotch.phenotype_truncNotch_versus_wtNotch.cls #wtNotch_versus_truncNotch.phenotype_truncNotch_versus_wtNotch.cls #wtNotch_versus_truncNotch_repos |
| Phenotype | phenotype_truncNotch_versus_wtNotch.cls#wtNotch_versus_truncNotch_repos |
| Upregulated in class | truncNotch |
| GeneSet | HUMANCYC_GLYCINE BETAINE DEGRADATION |
| Enrichment Score (ES) | -0.78377545 |
| Normalized Enrichment Score (NES) | -1.4392465 |
| Nominal p-value | 0.039855074 |
| FDR q-value | 0.5750998 |
| FWER p-Value | 1.0 |
| PROBE | DESCRIPTION (from dataset) | GENE SYMBOL | GENE_TITLE | RANK IN GENE LIST | RANK METRIC SCORE | RUNNING ES | CORE ENRICHMENT | |
|---|---|---|---|---|---|---|---|---|
| 1 | SARDH | 3060044 | 4440 | 0.106 | -0.2031 | No | ||
| 2 | SDSL | 6900435 | 4561 | 0.098 | -0.1767 | No | ||
| 3 | PIPOX | 70750 | 7806 | 0.002 | -0.3506 | No | ||
| 4 | BHMT | 6660138 | 8696 | -0.013 | -0.3939 | No | ||
| 5 | BHMT2 | 2030184 | 9164 | -0.021 | -0.4120 | No | ||
| 6 | DMGDH | 3830601 | 9514 | -0.027 | -0.4217 | No | ||
| 7 | SDS | 110242 6380725 | 9540 | -0.027 | -0.4139 | No | ||
| 8 | ST6GALNAC2 | 2680402 | 12449 | -0.111 | -0.5332 | Yes | ||
| 9 | SHMT1 | 5900132 | 17112 | -1.264 | -0.3608 | Yes | ||
| 10 | SHMT2 | 1850180 6040010 | 17179 | -1.320 | 0.0772 | Yes |

